
Michael Hladky
Trainer and consultant, push-based.io | Austria
Talk
Performance Measurements With Lighthouse User Flows
However, it can be quite an endeavor at times for it means you need to have a precise understanding of all the ins and outs of both performance data and performance tooling. The chrome team shipped a tremendous amount of new tools and features to it's dev tooling.
This talk will shed light on how to overcome this challenge and walk you through the pitfalls and tricks of the trade of Chrome Lighthouse, providing you with a complete roadmap for performance analysis and optimization with the latest tooling named user flows.
🎯 Takeaways
✓ understand the latest features of chrome dev tools
✓ setup user flows with puppeteer and lighthouse
✓ measure navigation, time spans and snapshots
About Michael Hladky
Workshop
Performance and RxJS in Angular Master Class
The web has never been more exciting! But it has also never been as demanding to our devices and infrastructure as it is today. Our browsers ship new features, and languages get updates only to squeeze out the last bit of performance we can get. The problem here, there are no real resources out there that would show us how to apply those optimization techniques in practice, which can be especially painful when it comes to framework-specific questions.
This talk will feature the most up-to-date information to expand your knowledge of performance optimization techniques beyond the basics. In the end, you will go home with lots of exercises to guide you and a wealth of insights to work with, impressed by how much faster your application can get.
Together we will take a closer look at what an auditing process looks like. Then, we will discuss how to read Flame Charts, learn how to navigate through the network tab, and increase our knowledge of network analysis features. Finally, we will take a spin on the brand-new Angular Performance DevTools and compare them with the original ChromeDevTools.
🎯 Takeaways
- How to record and analyze flame charts
- How to document performance issues and measure improvements
- How to detect performance bottlenecks
- Hands on with Angular’s brand new DevTools
- Blocking tasks and how to spot scripting bottlenecks
- Network analysis and improvement strategies
- Change detection strategies & IVY features
- Best & bad performance practices for modifying the DOM Structure and CSS rendering
- Runtime performance of scripting, rendering, and painting
In this session, we will take a closer look at what an auditing process looks like, discuss how to read Flame Charts, learn how to navigate through the network tab, and increase our knowledge of network analysis features.
Michael Hladky in action
Learn from the Best Featured Speakers

Ryan Carniato
Creator of SolidJS, Netlify | USA

Nishu Goel
Engineer (Web + Golang), GDE, epilot GmbH | Germany

Miško Hevery
Chief Technology Officer, Builder.io | USA

Luca Mezzalira
Principal Serverless Specialist Solutions Architect, AWS | UK

Shai Reznik
Founder, HiRez.io | Israel

Adam Bradley
Director of Technology, Builder.io | USA
Michael Hladky
Trainer and consultant, push-based.io | Austria

Karin Angel
Full Stack Team Lead, Sapiens | Israel

Nir Kaufman
Front End Guild Manager, Next Insurance | Israel

Arisa Fukuzaki
Developer Relations Engineer, Storyblok | Germany

Konrad Mattheis
CTO, Vizlib | Germany

Sebastian Gos
Development Manager, BEC | Poland

Piotr Tomiak
Senior Software Developer, JetBrains | Poland

Kamil Gałek
Senior Frontend Developer, BigPicture | Poland

Sam Bellen
Staff Developer Advocate Engineer, Auth0 | Belgium

Santosh Yadav
GDE, Senior Software Engineer, Celonis | Germany

Michał Jawulski
Managing Delivery Architect, Capgemini | Poland

Devlin Duldulao
Senior Consultant, Inmeta | Norway

Daniel Afonso
Developer Advocate, OLX | Portugal
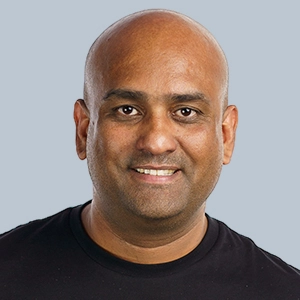
Dhananjay Kumar
Teacher and Consultant, ngIndia | India

Sebastian Witalec
Head of DevRel, SeMI Technologies | Denmark


Companies that support our community
Our Sponsors
By becoming a sponsor of JS Poland you will get an excellent opportunity to showcase your
company and products to
1000 most active European developers.
Such exposure will definitely help you to generate interest in your company, as well as allow
you
to find new business partners and potential employees.
To learn more about our sponsorship offer, please fill in the form.
Platinum Sponsor

Gold Sponsor

Gold Sponsor

Gold Sponsor

Gold Sponsor

Silver Sponsor

Silver Sponsor

Special Sponsor

Special Sponsor

Special Sponsor

Special Sponsor

Join our mailing list
Sign up to receive updates about JS Poland, including workshops, speaker previews, ticket launches, JS Awards, JavaScript Master Podcast, Behind the Code Magazine, CFP details and other exclusive content. We won’t spam you and will only send you emails we genuinely think you’ll find interesting. You can unsubscribe at any time and you can find more information here.